Assets
The Assets tab contains the confirmed attack surface of a project: the services, hosts, and domains that the platform attributes to the organisation. It offers the following sub-tabs.
| Sub-tab | Presentation |
|---|---|
| Services | A flat table of every service. Best for filtering and export. |
| Hosts | A master-detail view per host. Best for examining a single system. |
| Domains | A table of domains with their resolved addresses. |
| E-mail security | One card per mail domain, with the rating of seven mail protections. |
Services
| Column | Content |
|---|---|
| IP | The address of the host. Selecting it opens the host in the Hosts view. |
| FQDNs | The domain names that resolve to this service. |
| Virtual host | The virtual host under which the service answered, where applicable. |
| Protocol | The identified protocol, for example ssh, http, openport. |
| Port | The port number. |
| Software | The identified product and version. |
| Max CVSS score | The highest CVSS score among the vulnerabilities of this service. |
| Whois description | The description from the Whois record of the address range. |
| Screenshots | Captured images of HTTP(S) services. Automatic capture depends on the Take screenshots of HTTP(S) services project option; screenshots can also be requested from an expanded HTTP(S) service. |
Prioritising
Sort by Max CVSS score in descending order to place the most exposed services at the top. Combine this with a column filter on Port to concentrate on the protocols that matter most in your environment.
Hidden open ports
Some hosts answer on many ports without an identified protocol. These are typically CDNs and proxies. Each such port is listed with the protocol openport and tells you little on its own.
When a host has five or more of these ports (the default; your provider can set a different threshold), they are hidden. The host's ports with an identified protocol, for example https/443, are still shown. A host with no other services is not listed in Hosts. Hidden ports are also left out of the dashboard, the Whois and AS counts, the exports, and Removed services on the Scope tab.
To see the hidden ports, enter SuppressedOpenport:true in Filter settings (see Filter settings and filter syntax). The ports are checked again with every scan. They are shown again once the host answers on fewer such ports.
Hosts
The Hosts view lists every host on the left, with the number of its services. Selecting a host opens it in the right-hand pane, where its services are listed as protocol/port, for example, ssh/22, as rows that expand in place. Selecting a service in the list on the left scrolls to and expands the corresponding row.
View scan history, in the toolbar at the top right of the view, shows how the findings have changed across scans.
The expanded service
The heading of an expanded service states the service, the age of the finding, and the number of assigned CVEs. Beneath it are the following tabs. Tabs whose content depends on scan data are hidden when no corresponding data is available.
| Tab | Content |
|---|---|
| General | Banner, Timestamp, and the assigned CPEs. A CPE can be removed, or added manually using Banner path and CPE. |
| CVEs | The vulnerabilities assigned to the service. Shown only where at least one CVE is assigned; the tab label states the number. |
| Exploits | The assigned CVEs for which known exploits are available. Shown only where at least one such exploit exists; the tab label states the number. Expand an entry to see the exploit type, operating system, and a link to its details. |
| Findings | Findings supplied with the service data. Shown only where such findings exist; the tab label states the number. Expand a finding to inspect its title, target, link, problem type, CVSS vector, severity, description, and raw data. In the current view, you can edit the finding, attach screenshots, and select Save. |
| Certificates | Parsed TLS certificates presented by the service. Shown only where certificate data is available. It lists the common name, organisation, and organisational unit for the certificate subject and issuer. |
| Matches | The rules and search terms through which the service entered the scope. Shown only where at least one match exists; the tab label states the number. |
| Raw | The unprocessed scan result. |
| Notes | A free-text field for your own annotations. Select Save to store them. |
Requesting and viewing service screenshots
Expanded HTTP and HTTPS services include a screenshot gallery. Select a thumbnail to inspect the captured page in the gallery. Each image states when it was taken and which target it represents.
To capture the current page of an HTTP(S) service:
- Expand the service in the Hosts view.
- In the screenshot area, select Request screenshot.
- After the request completes, inspect the new image in the gallery.
Request screenshot is available only in the current, editable view. When viewing scan history, you can inspect existing images but cannot request another screenshot.
Classifying a service (where enabled)
Deployment-specific feature
Service classification is shown only in deployments where service tagging has been enabled. It is disabled by default, so the following controls may not appear in your environment. In scan history, existing classifications are read-only.
Four controls beneath the service heading record a security assessment of the service. They are the mechanism through which a team documents why a service matters.
| Control | Meaning |
|---|---|
| Mark as login service | Credentials may be transmitted. |
| Mark as unsecure administrative login | Should not be exposed to the internet. |
| Mark as unencrypted service | No transport encryption detected. |
| Mark as critical service | Should not be exposed to the internet. |
Correcting the software identification
Where the platform has assigned the wrong CPE, and therefore the wrong vulnerabilities:
- Open the General tab of the service.
- Select the delete control next to the incorrect CPE.
- Select the Banner path that carries the version information.
- Enter the correct CPE.
The vulnerability assignment is recalculated from the corrected CPE.
Removing a service
Select Remove service in the heading of the expanded service. The service is moved to Removed services on the Scope tab and is no longer reported as an asset.
Unassigning a vulnerability
On the CVEs tab, select Unassign CVE in the Actions column of the row. Use this where a vulnerability does not apply, for example, because a backport has fixed it without changing the version string.
| Column | Content |
|---|---|
| Name | The CVE identifier. |
| Severity | Critical, High, Medium, Low, or Informational. |
| Vector | The attack vector and the full CVSS vector string. |
| Description | The description of the vulnerability. Select Show full text for the complete text. |
| Exploits | Known exploits, where available. |
Domains
| Column | Content |
|---|---|
| Domain | The registered domain. |
| FQDNs | The fully qualified name. A leading *. denotes a wildcard entry. |
| IPv4 | The IPv4 addresses the name resolves to. |
| IPv6 | The IPv6 addresses the name resolves to. |
| Actions | Removes the entry from the assets. |
A domain without a resolved address is not necessarily inactive; it may serve mail or be registered defensively.
E-mail security
The E-mail security sub-tab shows how well the mail of every domain is protected against forged senders and against interception in transit. Every domain of the project with a mail server (MX record) is listed as a card with seven checks: TLS, DNSSEC, SPF, DMARC, DKIM, MTA-STS, and DANE. The glossary explains them.
The sub-tab is shown only for projects in Active mode, because the checks query DNS and connect to the mail servers. The checks run with every analysis and monitoring run while the option E-mail security checks is enabled in the project settings. A single domain cannot be checked again on demand.
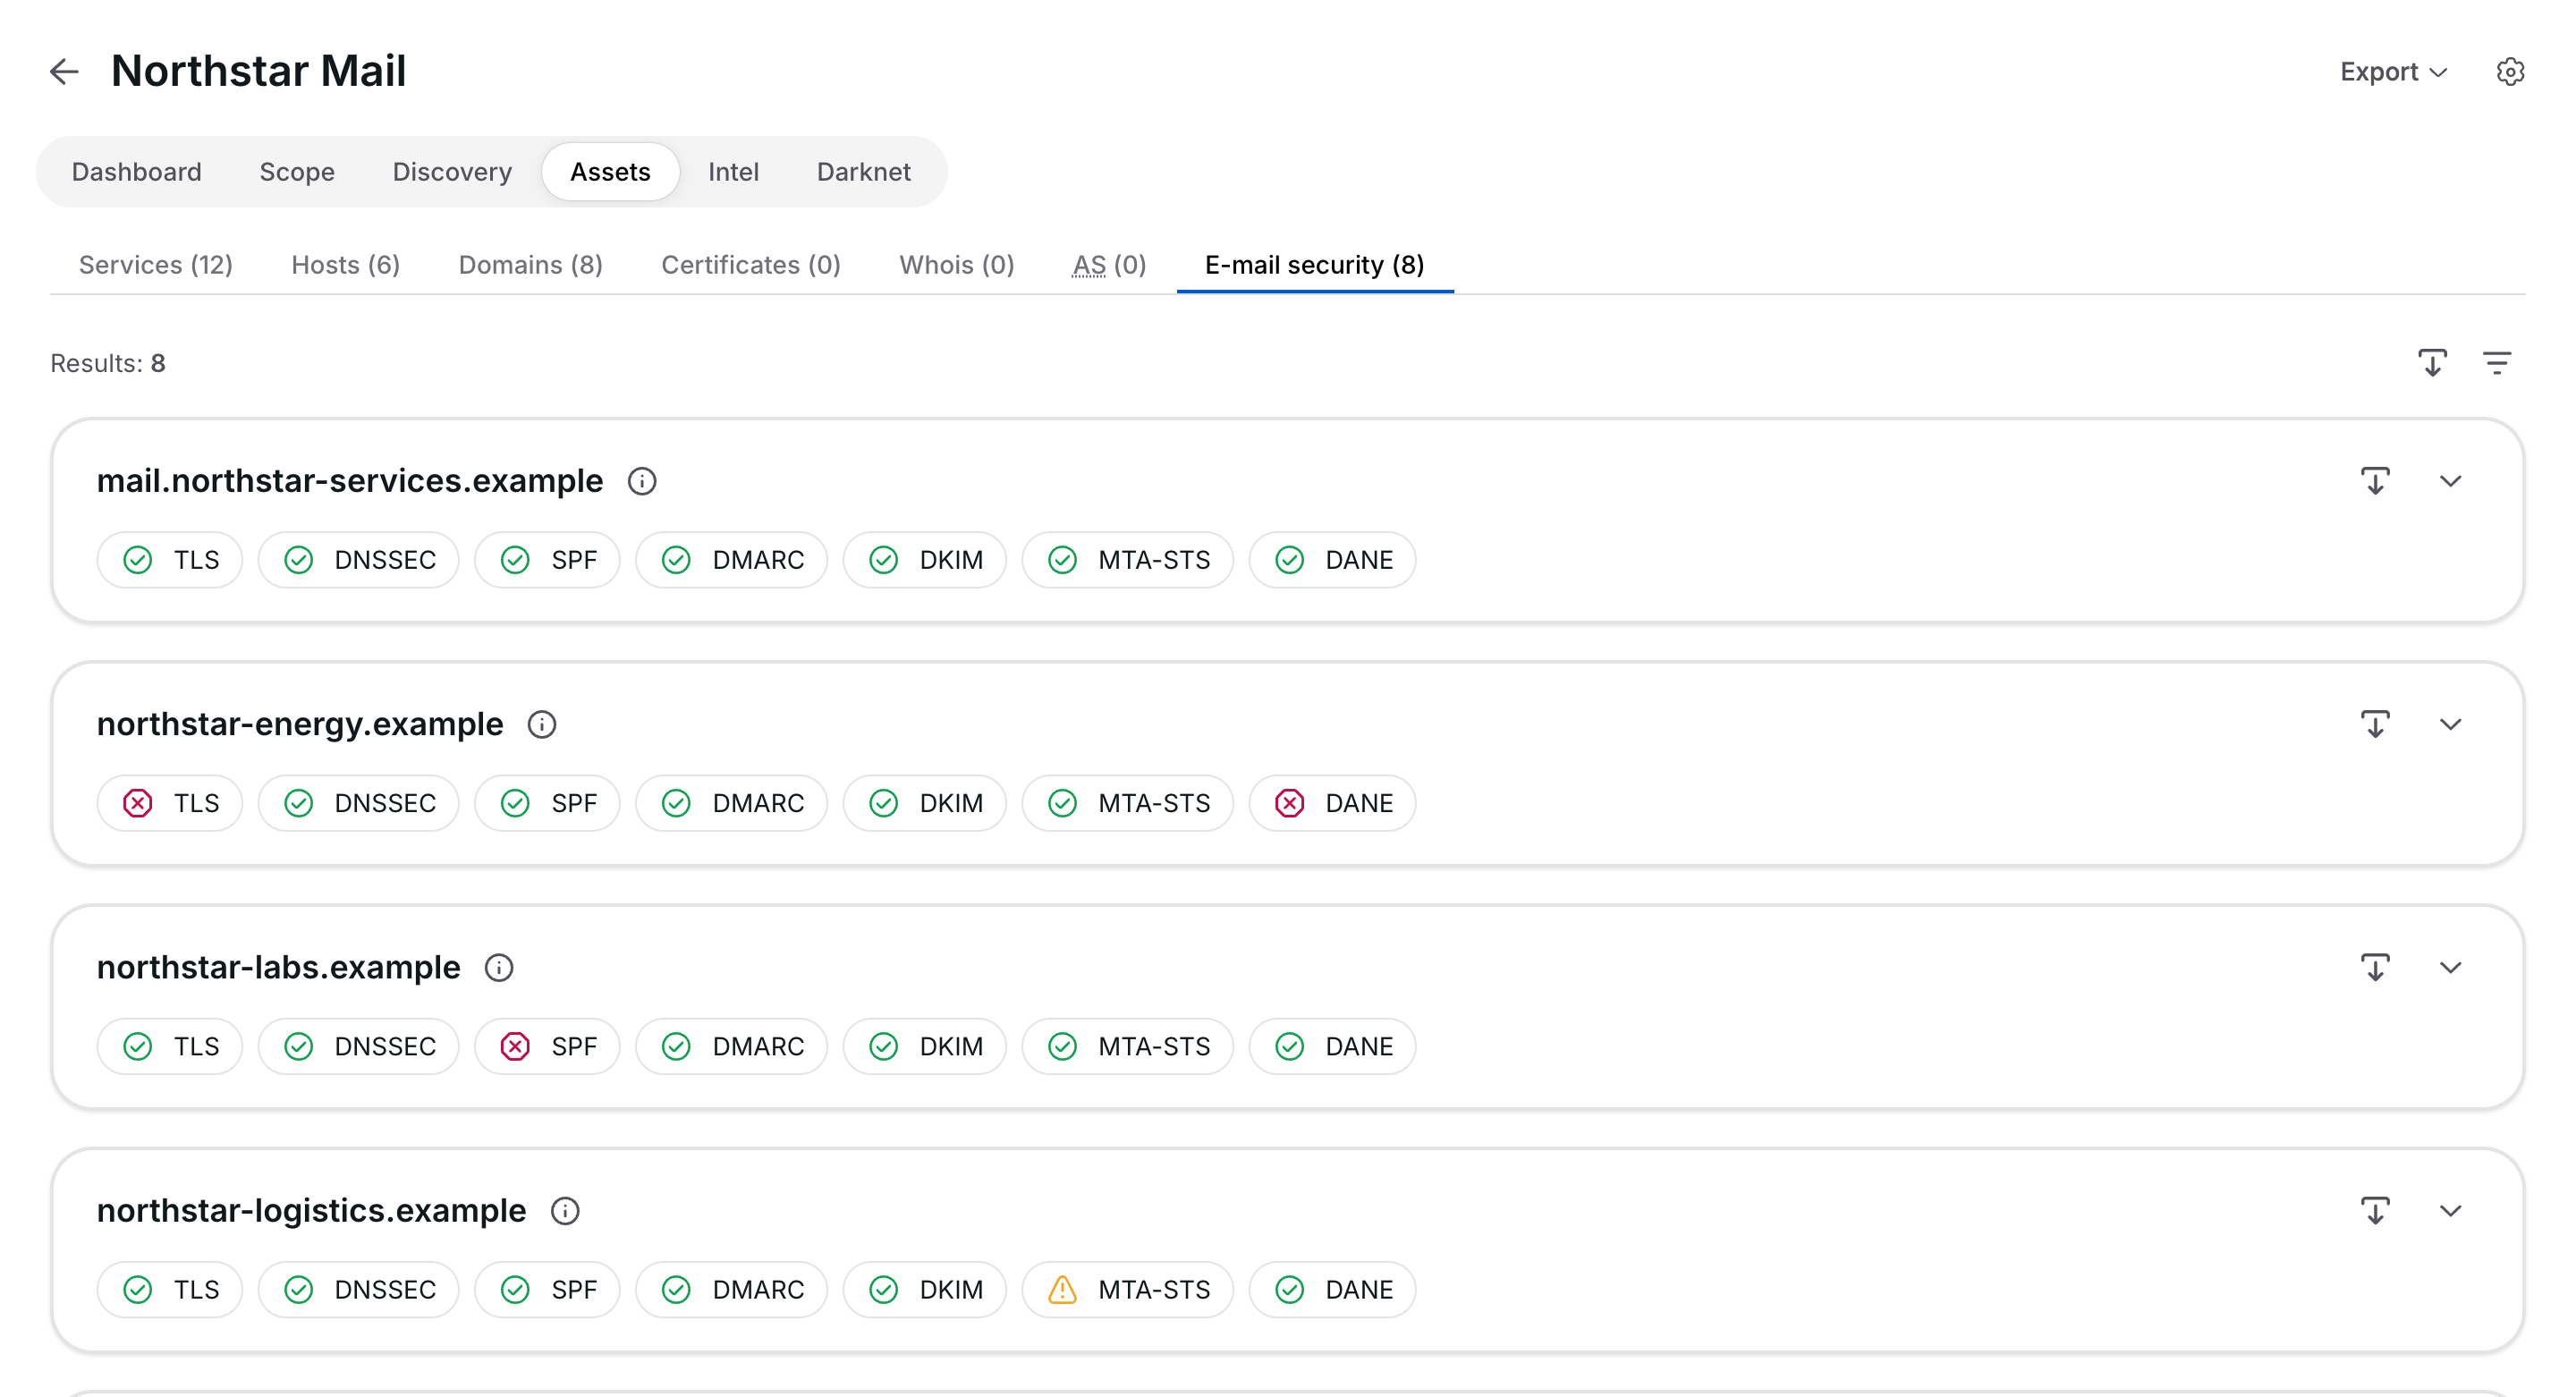
Each chip shows the rating of one check: Pass (green), Warn (yellow), Fail (red), or Unknown (grey) if the check could not be assessed. There is no overall rating per domain. Select a chip to open the check: a box states the reasons for the rating, followed by the data behind it, such as the mail servers and their cipher suites, the authorised SPF senders, or the DMARC policy. The information symbol next to the domain shows further DNS data, such as the name servers and the TLS-RPT record.
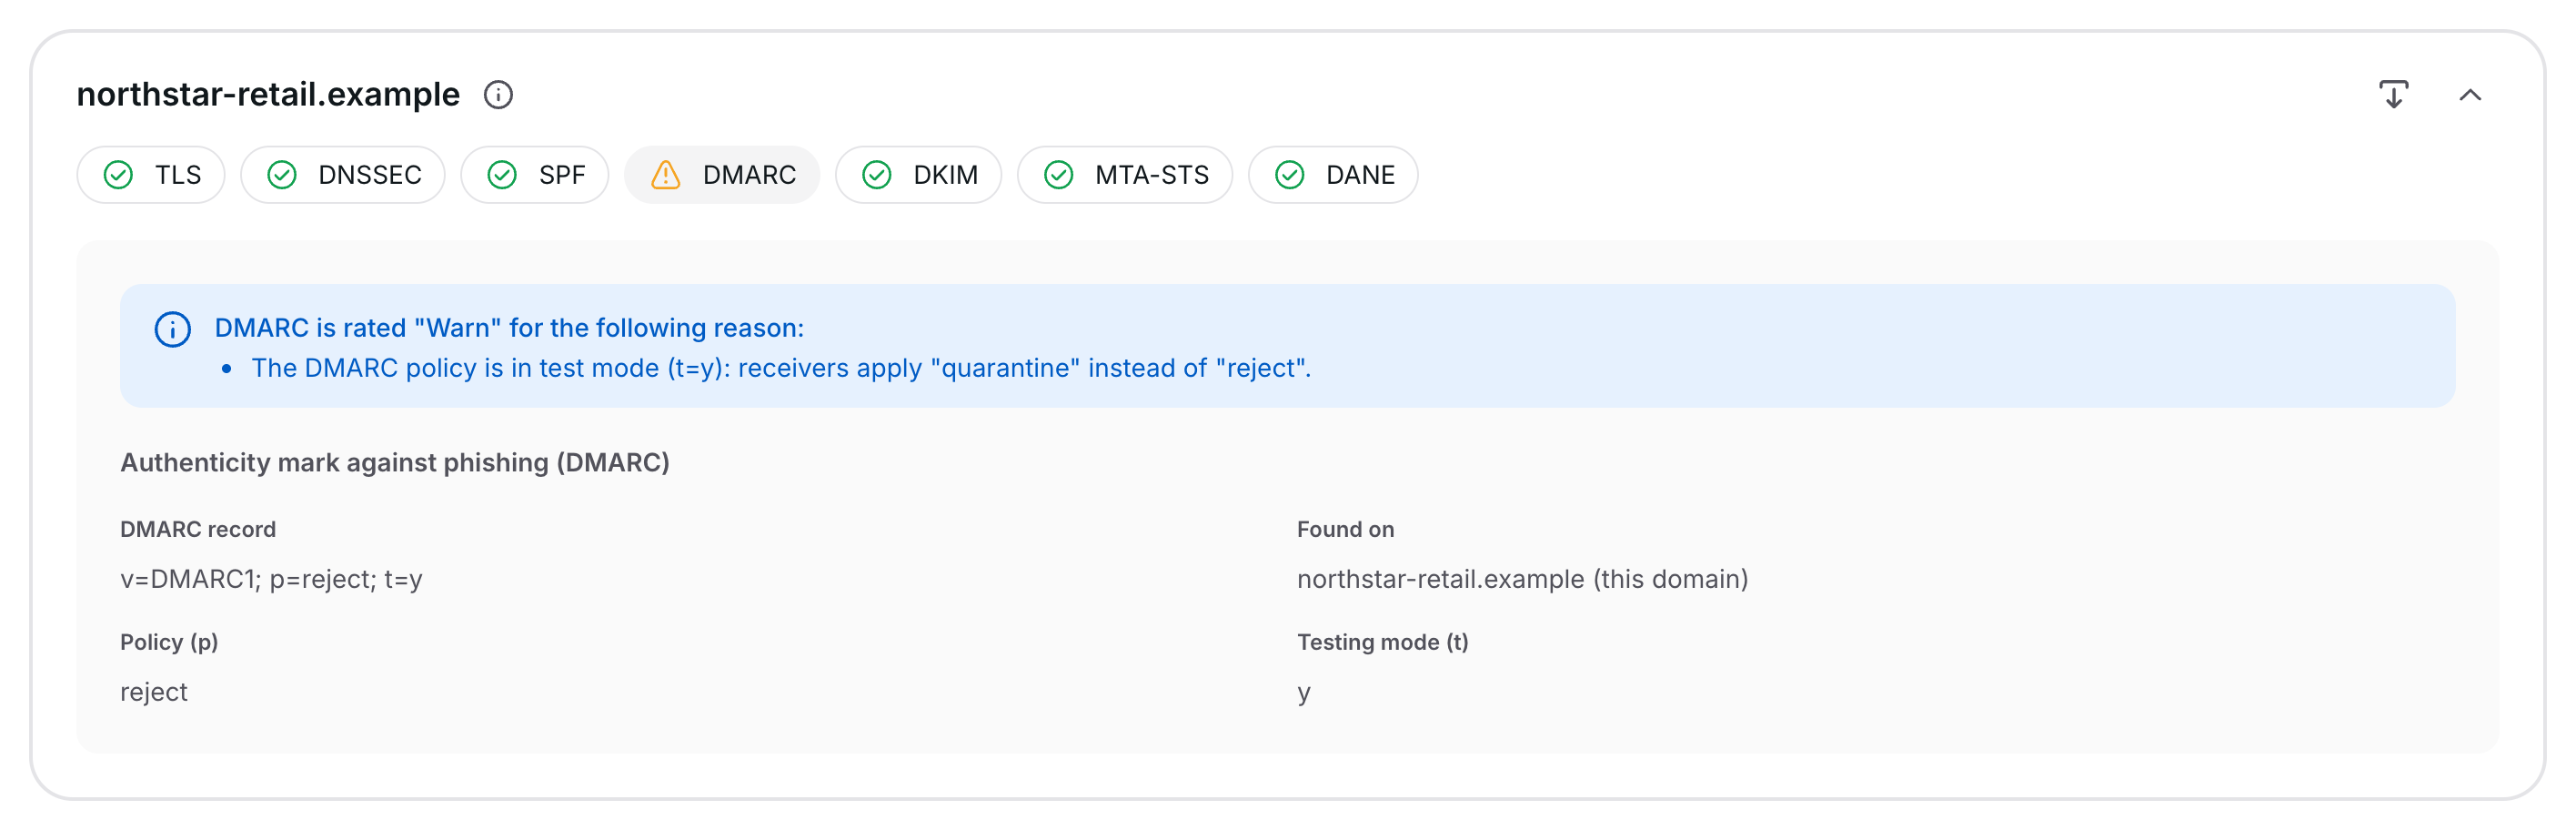
Filter accepts the filter syntax, with the rating of a check as Assessment.Checks.<check>.Status, for example Assessment.Checks.DMARC.Status:"warn". The checks are TLS, DNSSEC, SPF, DMARC, DKIM, MTASTS, and DANE; ratings are written in lower case. The download symbol above the list exports every matching domain as JSON, and the one on a card exports that domain. The Excel export of the project contains the results on the sheet Email Security; see Exporting project data.